System Performance
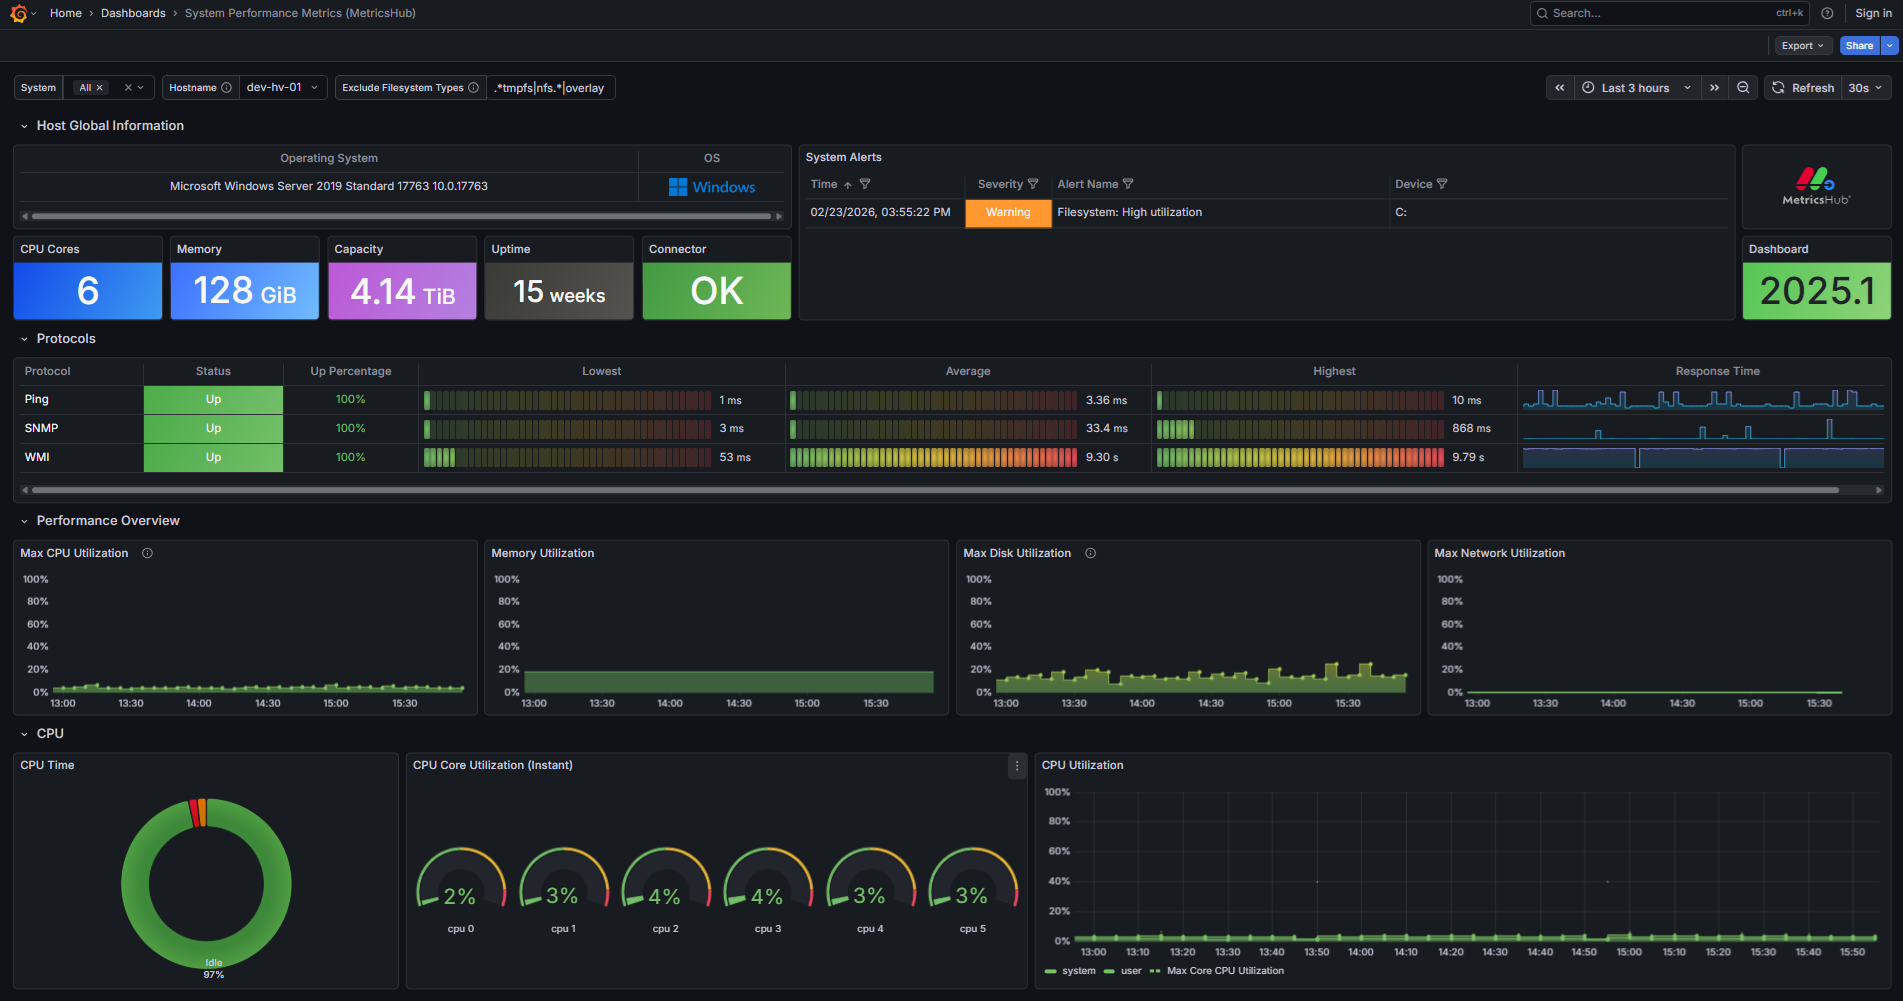
MetricsHub collects performance metrics from Linux, Windows, and UNIX systems and exposes them in the ready-to-use Grafana dashboard, System Performance Metrics (MetricsHub).
In this section, you will learn how to import this dashboard in Grafana.
Prerequisites
Before importing the System Performance Metrics (MetricsHub) dashboard in Grafana, ensure that you have:
- configured the monitoring of Linux, Windows, and UNIX ressources
- configured the Prometheus Server
- run both MetricsHub and the Prometheus server.
Importing the MetricsHub dashboard
-
Log on to Grafana
-
Import the dashboard(s)
-
Enter the dashboard ID
24058 -
Click Load
-
Select the Prometheus datasource
-
Click Import.
The System Performance Metrics (MetricsHub) dashboard is now loaded in Grafana.