Datadog Integration
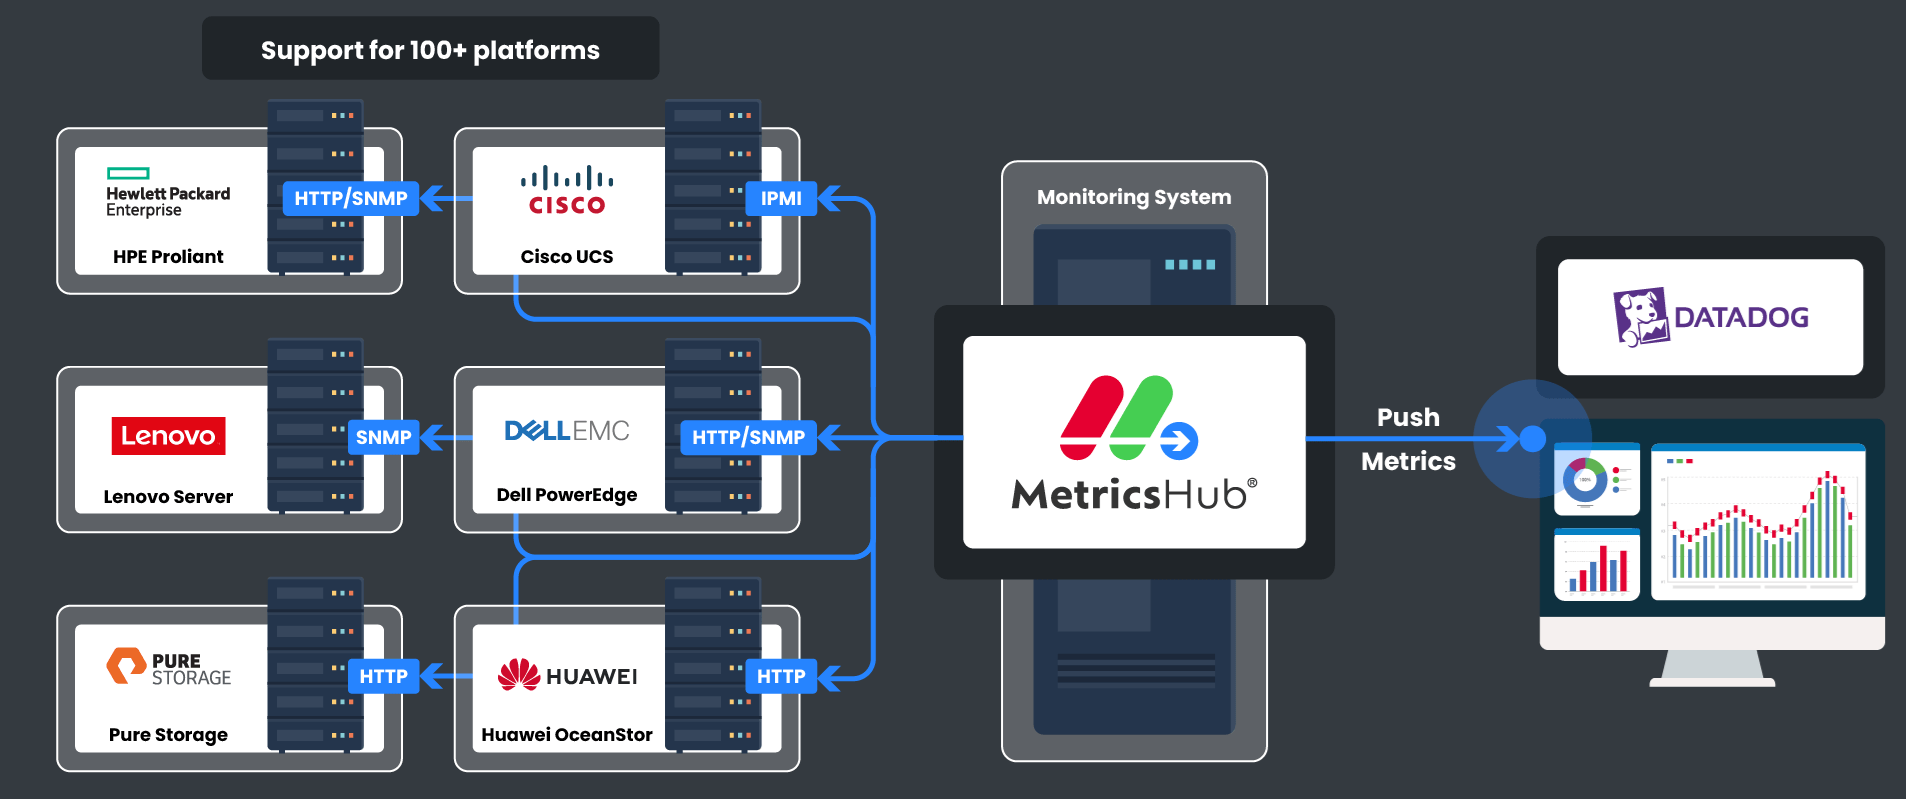
MetricsHub integrates seamlessly with your Datadog environment. The MetricsHub app, available through the Datadog Marketplace, includes a collection of dashboards and monitors designed to collect and expose observability and sustainability data for your IT infrastructure in a turn-key solution.
Integrating MetricsHub with your Datadog SaaS platform only requires a few installation and configuration steps.
IMPORTANT
To ensure seamless integration of MetricsHub with Datadog, all metrics collected by MetricsHub must be prefixed withmetricshub., as detailed below.Although this documentation uses standard OpenTelemetry metric names (e.g.,
system.cpu.time), these metrics will appear in Datadog under themetricshub.namespace (e.g.,metricshub.system.cpu.time).The dashboards and monitors provided with the MetricsHub integration on the Datadog Marketplace are designed to query metrics using this prefix.
Prerequisites
Before you can start viewing the metrics collected by MetricsHub in Datadog, you must have:
- Subscribed to MetricsHub from the Datadog Marketplace
- Created an API key in Datadog as explained in the Datadog User Documentation
- Installed MetricsHub on one or more systems that has network access to the physical servers, switches and storage systems you need to monitor
- Configured resource monitoring.
Configuring the integration
Pushing metrics to Datadog
-
Edit the
exporterssection of theotel/otel-config.yamlconfiguration file:exporters:
datadog/api:
api:
key: <apikey>
# site: datadoghq.com
# site: datadoghq.eu
# site: ddog-gov.com
# For further details, refer to https://docs.datadoghq.com/getting_started/site/
metrics:
resource_attributes_as_tags: truewhere
<apikey>corresponds to your Datadog API key. -
To ensure dashboards and monitors provided with the MetricsHub integration function correctly, add a
transformprocessor to prefix the metrics collected by MetricsHub withmetricshub.:transform/datadog:
# Apply transformations to all metrics
metric_statements:
- context: datapoint
statements:
# prefix all metrics by `metricshub.` (except `otelcol` metrics, which come from the OpenTelemetry Collector itself)
- set(metric.name, Concat(["metricshub", metric.name], ".")) where not IsMatch(metric.name, "^(metricshub\\.|otelcol_)") -
Declare the receiver, processor, and exporter in a separate pipeline dedicated to Datadog, to avoid affecting other exporters with metrics prefixed with
metricshub.:service:
extensions: [health_check, basicauth, basicauth/partner]
pipelines:
# Dedicated pipeline for Datadog
metrics/datadog:
receivers: [otlp, prometheus/internal]
processors: [memory_limiter, batch, transform/datadog]
exporters: [datadog/api] -
Restart MetricsHub to apply your changes.
Refer to Sending Telemetry to Observability Platforms for more details.
Configuring sustainability settings
To ensure dashboards are properly populated, you must configure the sustainability metrics hw.site.carbon_intensity, hw.site.electricity_cost, and hw.site.pue as explained in Configure Sustainability Metrics.
Adding monitors
To be notified in Datadog about any hardware failure, go to Monitors > New Monitor and add all the Recommended monitors for MetricsHub.
Creating your own monitors based on the ones listed as recommended allows you to customize the notification settings of each monitor.
Using the MetricsHub dashboards
MetricsHub comes with the following dashboards which leverage the metrics collected by MetricsHub:
| Dashboard | Description |
|---|---|
| MetricsHub Hardware Overview | Overview of all monitored hosts, with a focus on sustainability |
| MetricsHub Hardware Site | Hardware metrics associated to one site (a data center or a server room) and its monitored hosts |
| MetricsHub Hardware Host | Hardware metrics and alerts associated to one host and its internal devices |
| MetricsHub System Performance | System performance and capacity metrics for Linux and Windows hosts |