Hardware and Sustainability KPIs
MetricsHub collects the hardware health and performance metrics as well as the sustainability KPIs of any server, storage system, or network switch available in your on-prem infrastructure and exposes the telemetry data in the Hardware Main (MetricsHub), Hardware Site (MetricsHub), and Hardware Host (MetricsHub) Grafana dashboards.
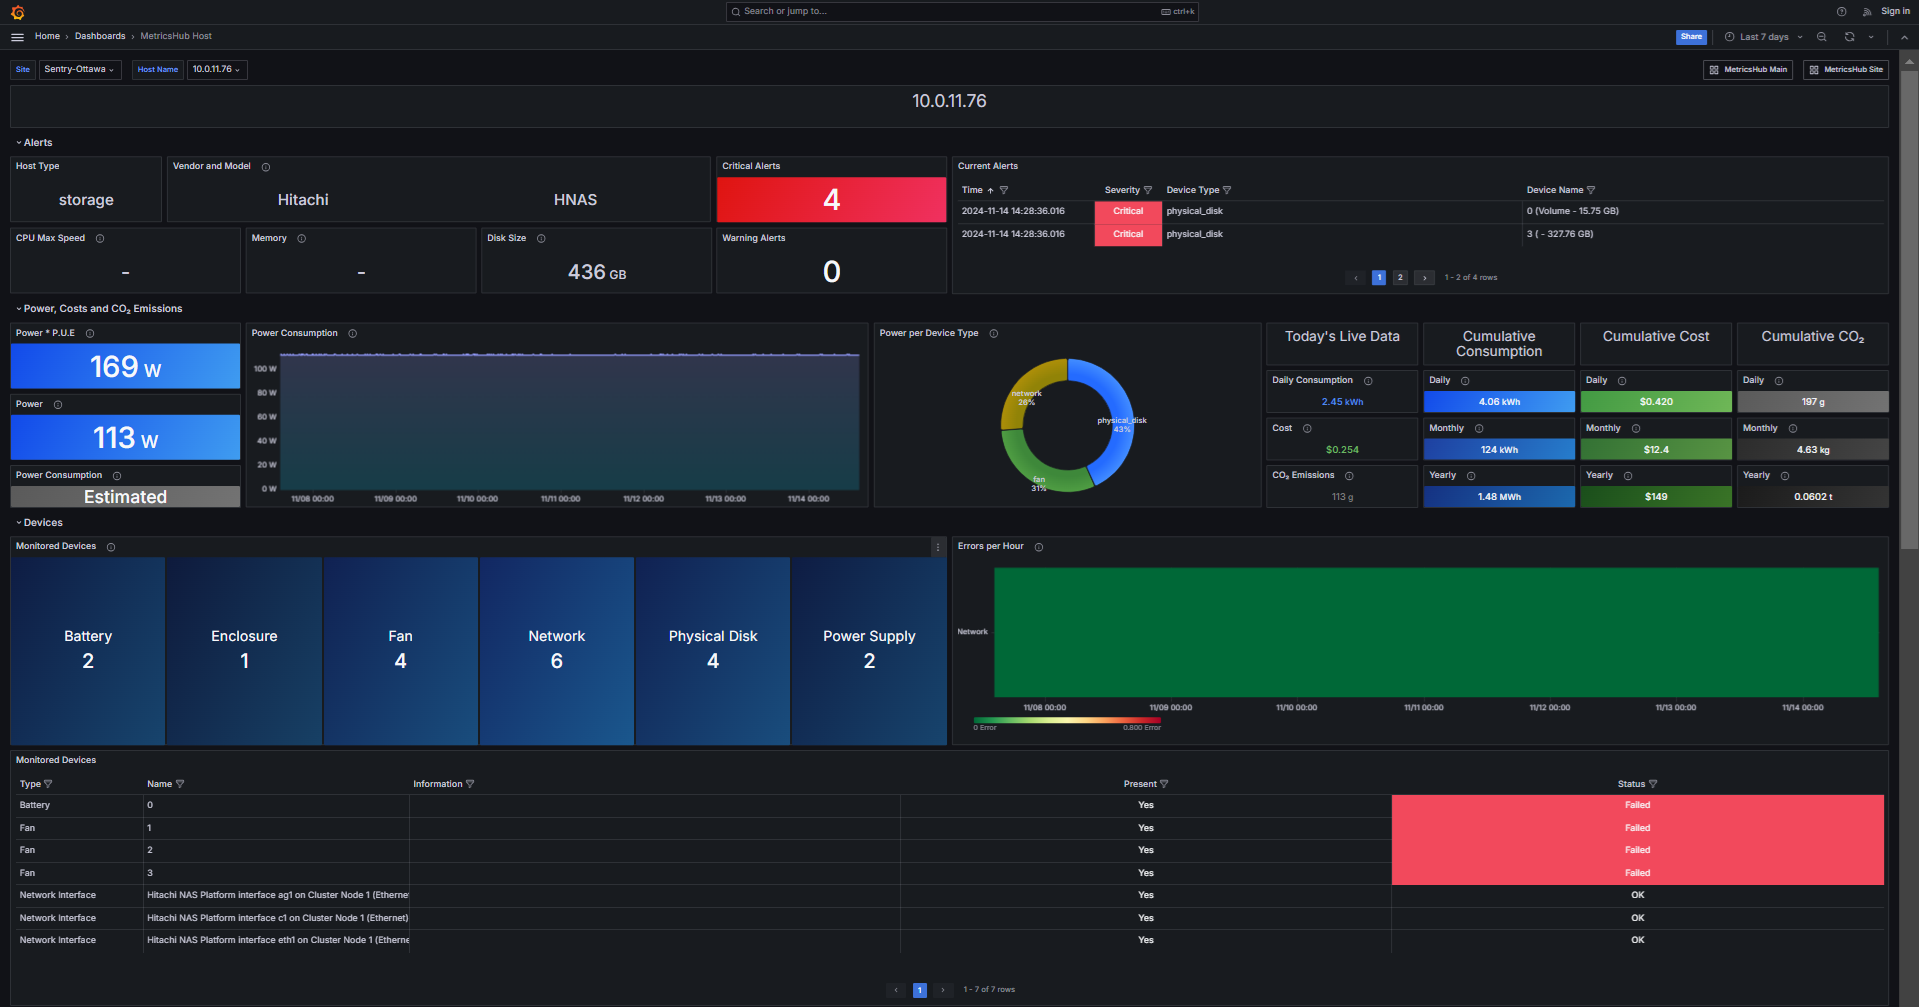
MetricsHub Host - Metrics associated to one host and its internal components
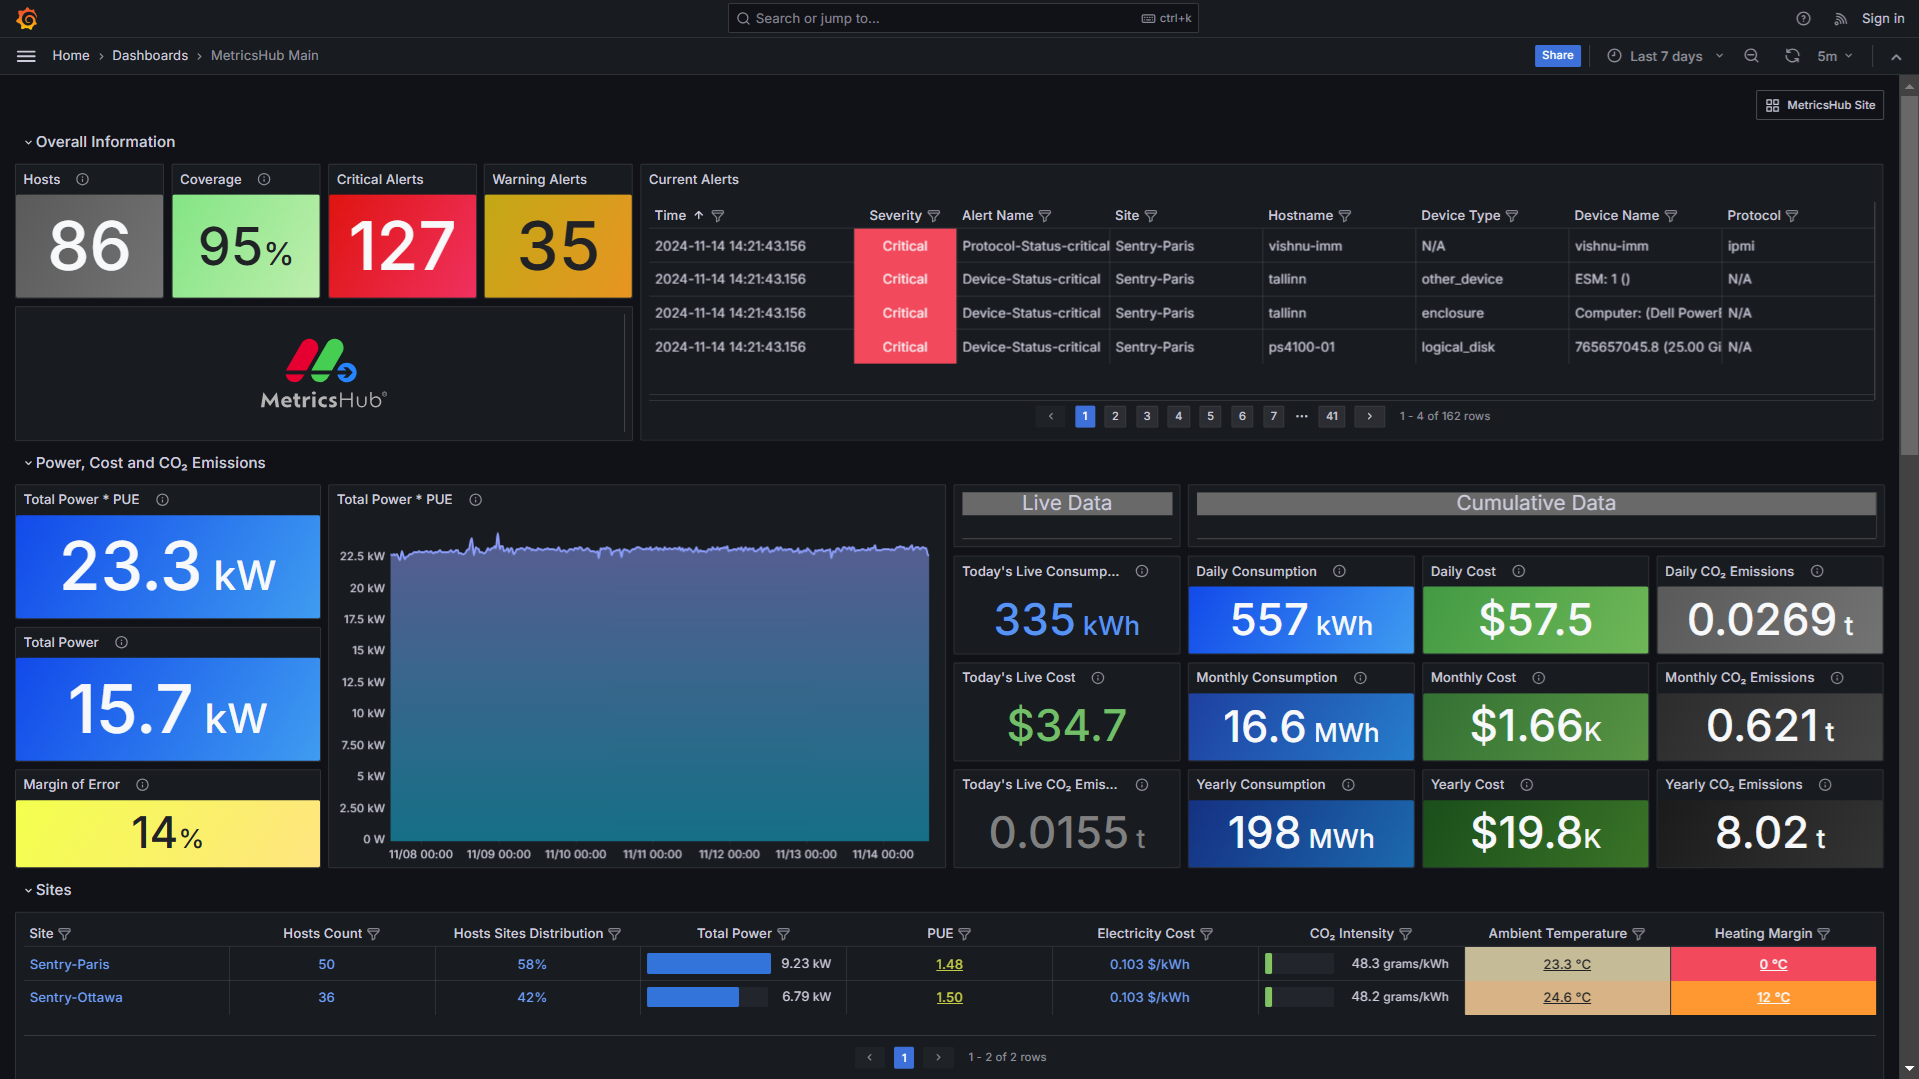
MetricsHub Main - Overview of all monitored sites
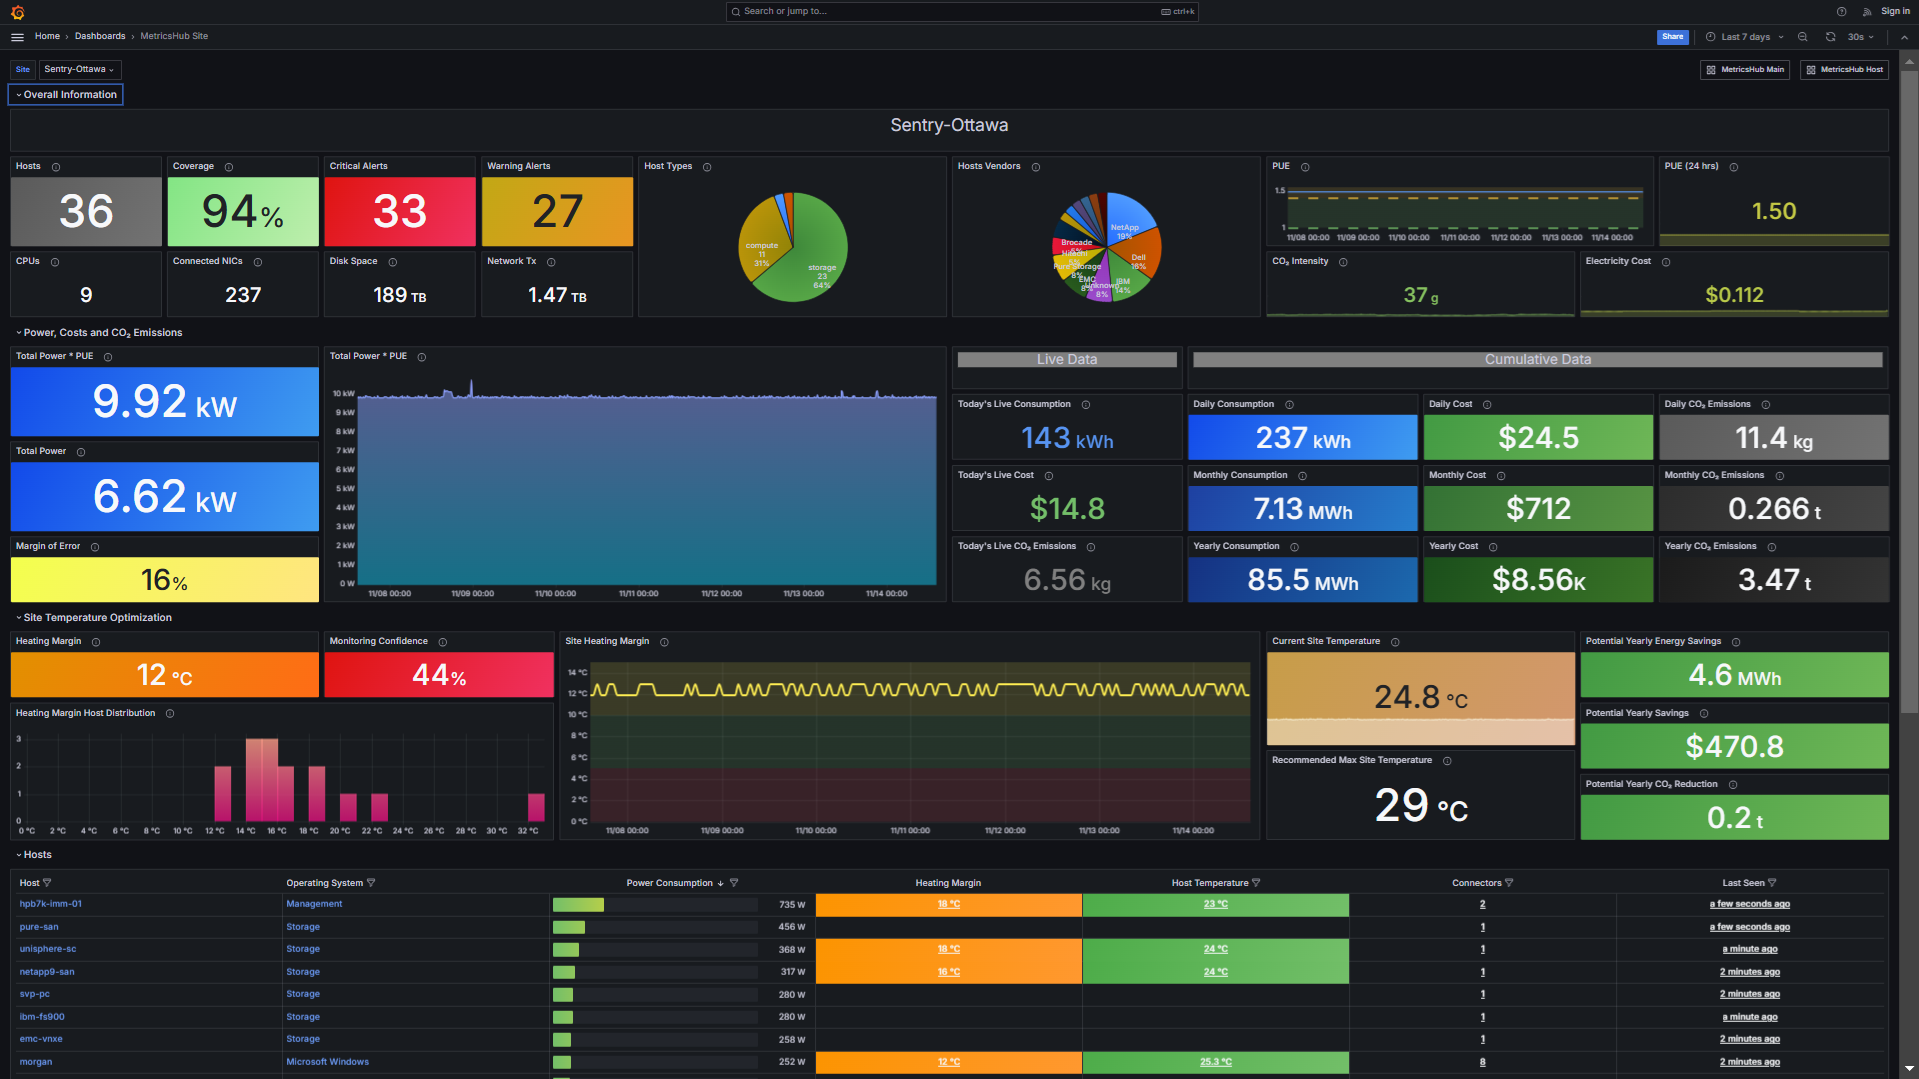
MetricsHub Site - Metrics associated to one site and its monitored hosts
MetricsHub Host - Metrics associated to one host and its internal components
MetricsHub Main - Overview of all monitored sites
In this section, you will learn how to import the MetricsHub dashboards in Grafana.
Prerequisites
Before importing the MetricsHub dashboards in Grafana, ensure that you have:
- configured the monitoring of your resources
- configured the sustainability metrics
- configured the Prometheus Server
- run both MetricsHub and the Prometheus server.
Importing the MetricsHub dashboards
-
Log on to Grafana
-
Import the dashboard(s)
-
Enter the dashboard ID:
22053for the Hardware Main (MetricsHub) dashboard22052for the Hardware Site (MetricsHub) dashboard22051for the Hardware Host (MetricsHub) dashboard
-
Click Load
-
Select the Prometheus datasource
-
Click Import
-
Repeat the procedure to import all the Hardware (MetricsHub) dashboards.
The MetricsHub dashboards are now loaded in Grafana:
| Dashboard | Description |
|---|---|
| Hardware Main (MetricsHub) | Overview of all monitored sites |
| Hardware Site (MetricsHub) | Metrics associated to one site (a data center or a server room) and its monitored hosts |
| Hardware Host (MetricsHub) | Metrics associated to one host and its internal components |