About MetricsHub
MetricsHub is a metrics collector for OpenTelemetry designed to deliver real-time infrastructure metrics to your existing observability stack.
It natively supports core infrastructure monitoring, including servers, storage systems, network devices, and databases, and can be extended through additional connectors and configuration to address evolving monitoring requirements.
MetricsHub is available in two editions:
- The Community Edition Community — Free and open source, it provides essential monitoring capabilities.
- The Enterprise Edition Enterprise — Extended monitoring coverage and 24×7 support.
Why MetricsHub?
Modern infrastructure monitoring comes with several common challenges. MetricsHub is designed to address them.
| Challenge | How MetricsHub Addresses It |
|---|---|
| Vendor lock-in | Its OpenTelemetry-native architecture enables exporting telemetry data to 30+ platforms, including Prometheus, Datadog, Cisco Splunk, or New Relic. |
| Complex deployments | A single MetricsHub Agent can monitor up to 1,000 remote hosts. |
| Limited monitoring coverage | MetricsHub supports servers and devices across a wide range of vendors, models, and generations. |
| Custom monitoring | Extend monitoring through simple YAML configuration without custom code. |
| Sustainability insights | Track energy consumption and carbon footprint out-of-the-box. |
How MetricsHub Works
MetricsHub is a metrics collection agent running in your infrastructure network. A single instance of MetricsHub can remotely monitor up to 1,000 hosts, eliminating the need to deploy an agent on every monitored system.
MetricsHub uses a modular, connector-based architecture. Each connector contains the logic required to collect metrics using standard access methods (SNMP, SSH, HTTP, IPMI, JMX, SQL/JDBC, WMI, WinRM). With 300+ built-in connectors, MetricsHub can monitor servers across a broad range of vendors, models, and generations.
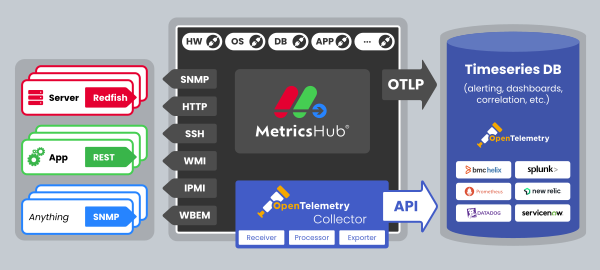
The collected metrics can be sent to any OpenTelemetry-compatible platform, including Datadog, Grafana, and Cisco Splunk using either:
- the OTLP Protocol Community
- the embedded, managed, and secured OpenTelemetry Collector Enterprise.
MetricsHub Key Features
-
Multi-protocol data collection — Collect metrics remotely using standard protocols, including HTTP, IPMI, JMX, SNMP, SSH, WBEM, WinRM, and WMI.
-
OpenTelemetry native — Strict adherence to semantic conventions, native OTLP export, and seamless integration with the OpenTelemetry Collector.
-
300+ built-in connectors Enterprise — Broad coverage across servers, storage systems, network devices, databases, and enterprise applications.
-
Custom monitoring — Extend monitoring coverage through declarative YAML configuration without custom code.
-
Sustainability metrics — Monitor power consumption, carbon intensity, and electricity costs to support energy efficiency initiatives.
-
Enterprise-grade capabilities Enterprise — Secure credential management, encrypted password storage, and 24×7 support.
Get Started
- Choose your edition — Community orEnterprise
- Follow a quick start guide:
- Configure monitoring for your resources